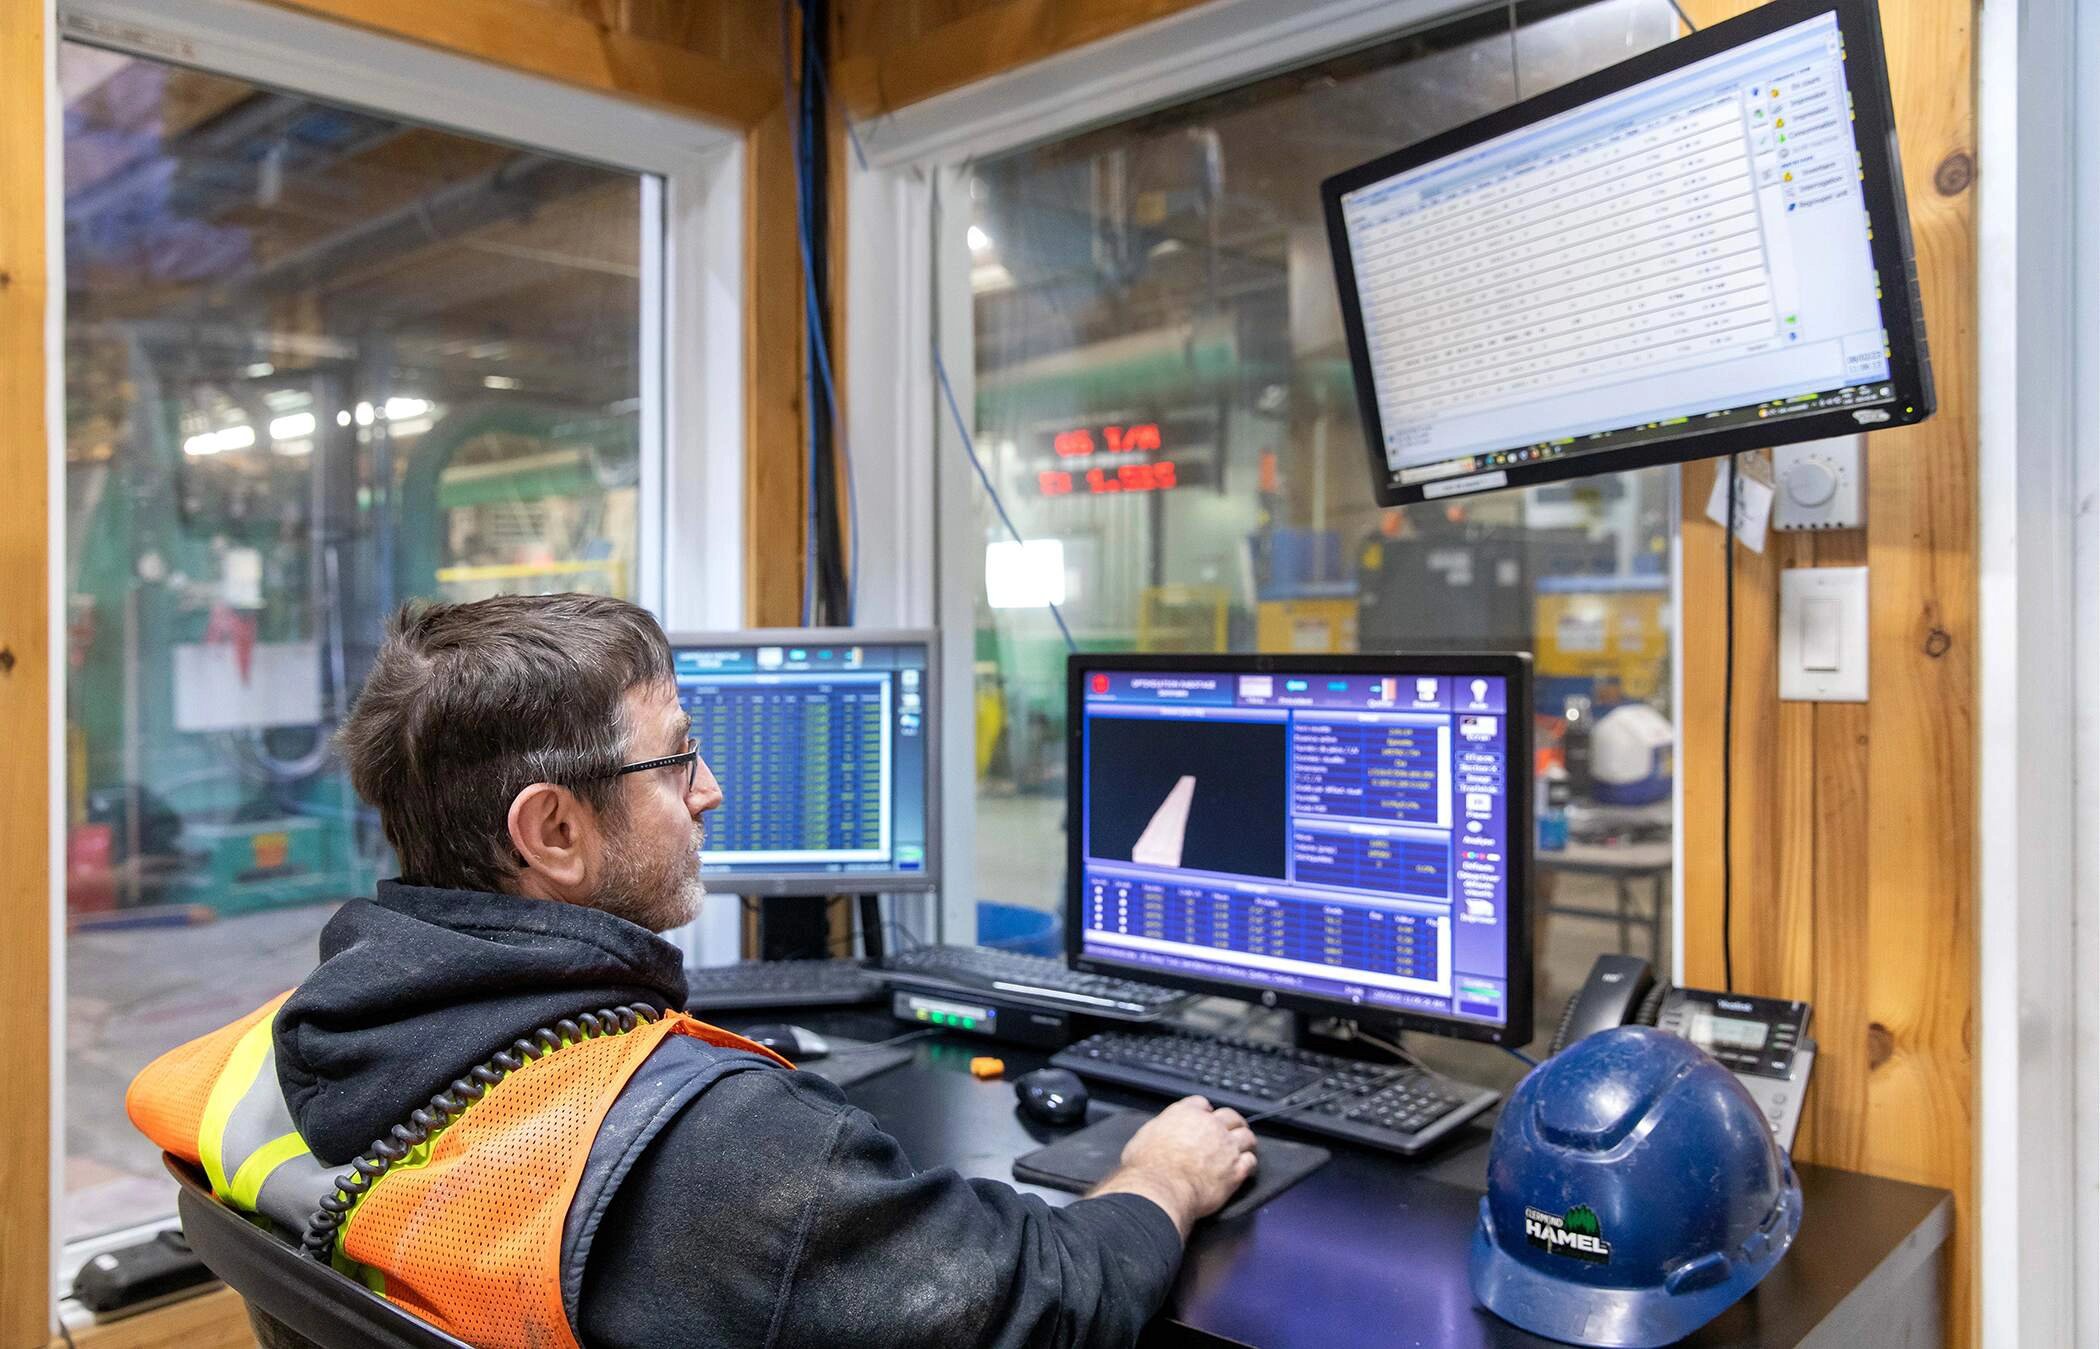
By making all data analyzable, InSite puts it to work making your plant more efficient than ever before.

The InSite digital platform tunes up your operations by monitoring all critical stages of production and controlling the quality of all products processed in the plant.

To measure, analyze and improve!

Every dashboard you’ve been waiting for

Debarking icon

Debarking performance

Monitoring key performance indicators:
  • Distribution of logs per debarker and distribution by diameter class (revenue),
  • Average diameter per debarker,
  • Efficiency rate per debarker (MBF/hour) per 15-minute interval and per shift,
  • Availability rate and downtime monitoring (upstream, downstream, machine)
  • Sawing icon

    Sawing performance

    Monitoring key performance indicators:
  • Log analysis at the sawing line (number, volume, average diameter),
  • Material yield rate, efficiency (logs/minute) per 15-minute interval and per shift.
  • Availability rate and downtime monitoring (upstream, downstream, machine)
  • Edging icon

    Edging performance dashboard

    Monitoring key performance indicators:
  • Parts analysis (number, volume),
  • Efficiency rate (parts/minute, full blocks) per 15-minute intervals and per shift,
  • Availability rate and downtime monitoring (upstream, downstream, machine)
  • Wood trimming icon

    Trimming performance

    Monitoring key performance indicators:
  • Parts follow-up (number, volume, all slash, returns, trim)
  • Efficiency rate (MBF or m3/hour, full blocks) per 15-minute interval and per shift,
  • Availability rate and downtime monitoring (upstream, downstream, machine)
  • Stacking icon

    Stacking performance

    Monitoring key performance indicators:
  • Distribution of manufactured parts (number, volume, %, grade, length),
  • Efficiency rate (lot, row, part) per 15-minute interval and per shift,
  • Availability rate per stacker and downtime monitoring (upstream, downstream, machine)
  • Downtime causes icon

    Measurement of downtime causes

    Configuring plant levels and departments. Setting up data.
  • Option 1: manually via digital form
  • Option 2: automatically by capture box
  • Option 3: direct synchronization on equipment.
  • Dashboard icon

    Shutdowns and availability dashboard

    Identifying and recording downtime on each piece of equipment for analyzing reasons for downtime
    Humidity icon

    Continuous humidity analysis

    Collecting data from humidity sensor and analyzing drying performance to meet standards and increase the quality of secondary wood-processing products. The data is available in a multi-criteria dashboard (product, drying batch, dryer, mill of origin...).
    our customized dashboards make your equipments data talk debarking, sawing, edging, trimming, stacking and downtime

    Get in touch with us

    Find out more about InSite.

    A short conversation is much better than an email exchange for getting rapid and precise answers for the solutions you’re looking for. Set up a call today.
    optimize each step of the wood transformation process in the office and in the factory, from purchase to shipping
    EFFECTO OnSite
    For immediate improvement in your plant’s day-to-day operations, a number of InSite features can be combined with the OnSite Manufacturing Execution System (MES).